Overall description of Data Source
This data source contains data about the “hourly wages by highest level of education attained and gender” in the U.S. It covers the period of 1973-2022, but is not expected to be updated. The data is taken from the Economic Policy Institute within the “State of Working America Data Library”.
Visualizations
Below you will find visualizations that model wages data in the United States. Each graph has corresponding descriptive titles and insights located below the image.
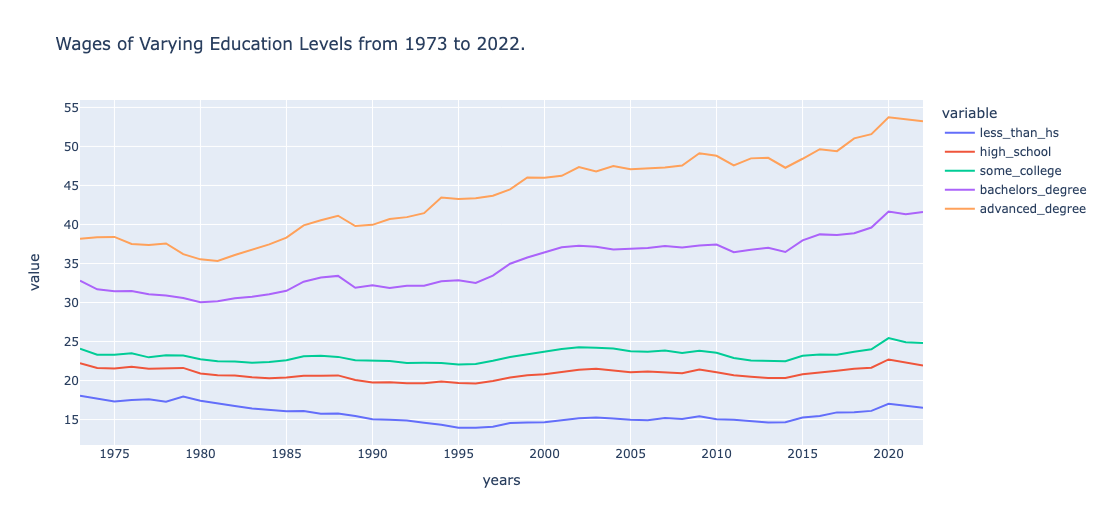
Wage by Education Level Overtime
Click here to view full interactive visualization!
Insights:
Overall, we expected the wages for all individuals from the data set to be higher with a higher
education level. Something surprising we noticed was that the wages for those with a high school
diploma and some college education have a very small wage gap. We expected the bachelor’s degree
and some college education to have the largest gap, but were surprised by the large gap between
the advanced degree and bachelor’s degree. As expected, wages generally increased over time.
.png)
Funnel Graph of Wages by Education Level for First Year Data (1973)
Click here to view full interactive visualization!
Insights:
This visualization displays the differences in the size of the average wage during 1973. We found there
was not a significant difference in wage between a less-than-high school education and an advanced degree
(only a $20.10 difference). This makes sense because money held a higher value at the time.
_viz_embed.png)
Funnel Graph of Wages by Education Level for Last Year Data (2022)
Click here to view full interactive visualization!
Insights:
This visualization displays the differences in the size of the average wage during 2022. In comparison
to the 1973 difference, the difference between a less-than-high school education and an advanced degree
is very large (a $36.70 difference). This makes sense because of inflation over time and people being
rewarded for achieving higher education.
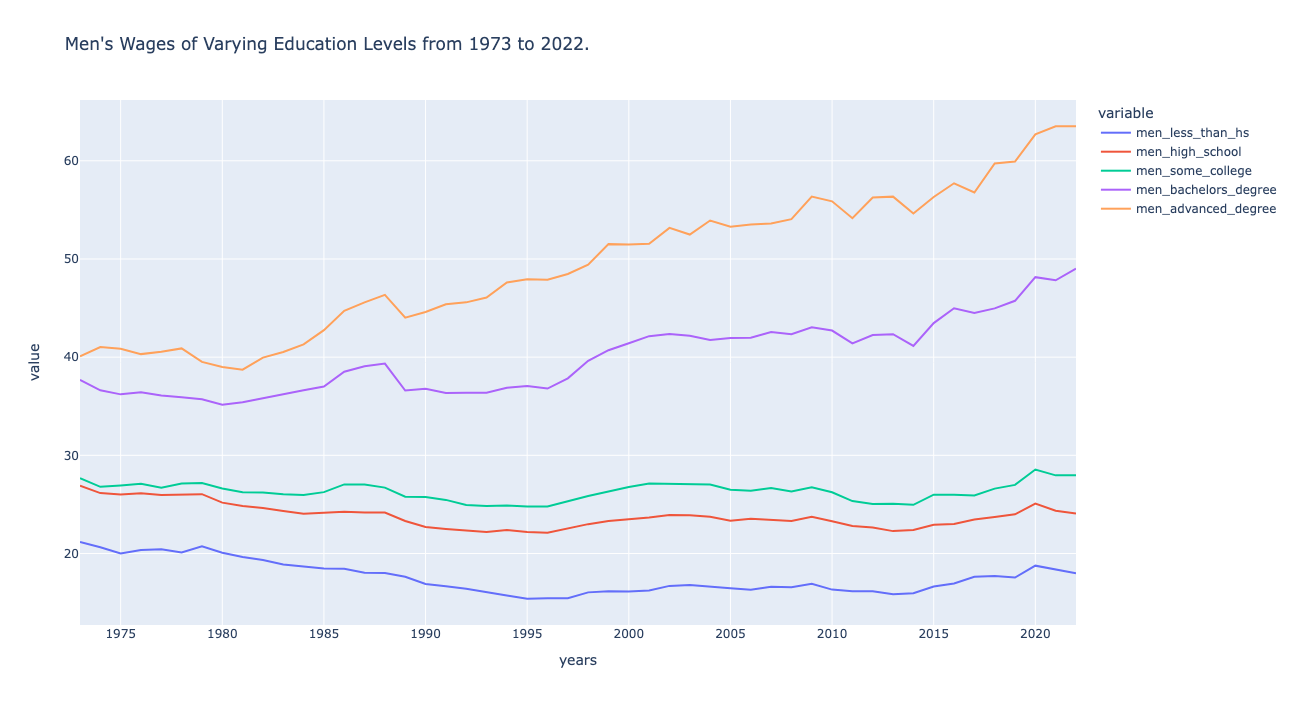
Men's Wages by Education Level Overtime
Click here to view full interactive visualization!
Insights:
As we expected, the wages for men increase with a higher level of education. We also expected
the wages to generally increase over time, and were surprised by how the men with a less than
high school education decreased over time; this could be because society began to value education
more as time progressed. There was also a large increase in wages around 1985, which could be a
time where the economy was thriving.
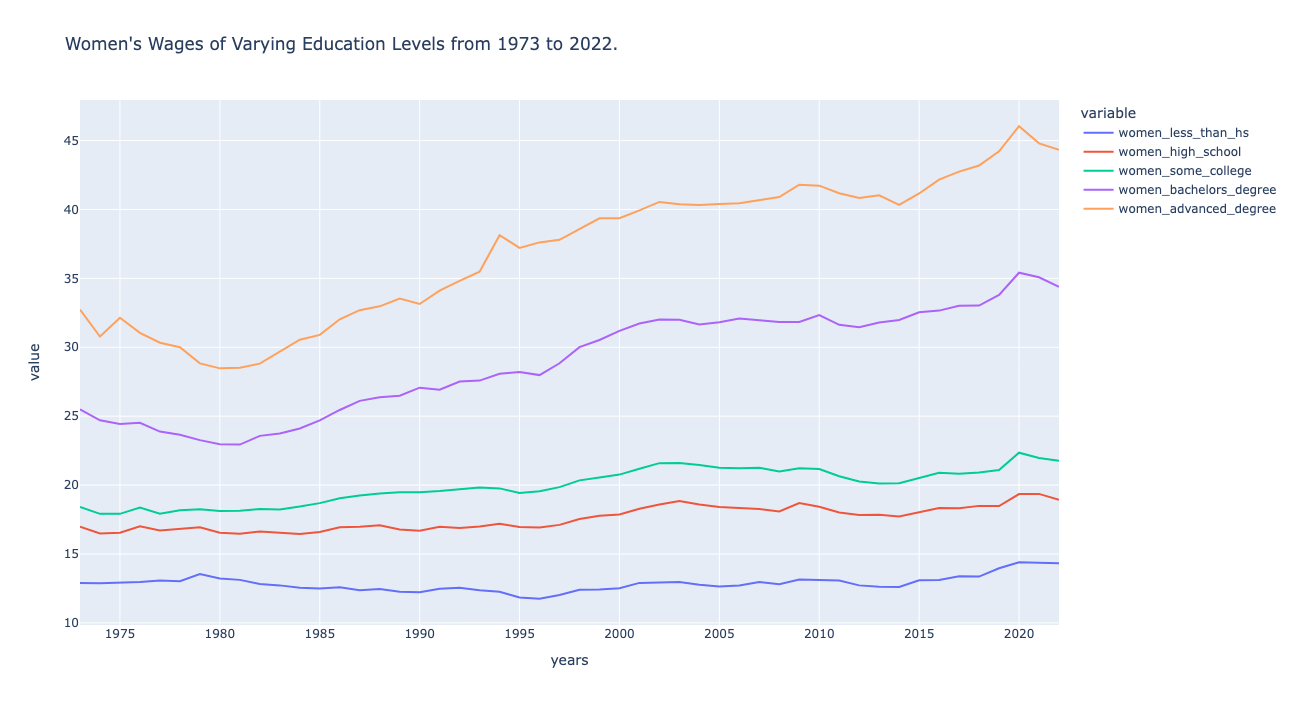
Women's Wages by Education Level Overtime
Click here to view full interactive visualization!
Insights:
As expected, the wages for women increase as their level of education increases. There is
a very large gap between having some college education, a bachelor's degree, and an advanced
degree. This shows that it is beneficial to attain an advanced degree, if possible. There was
a pretty decent decrease in wages around the late 1970s and early 1980s; this could be because
of stagflation around 1980, where inflation increased and the employment rate decreased.
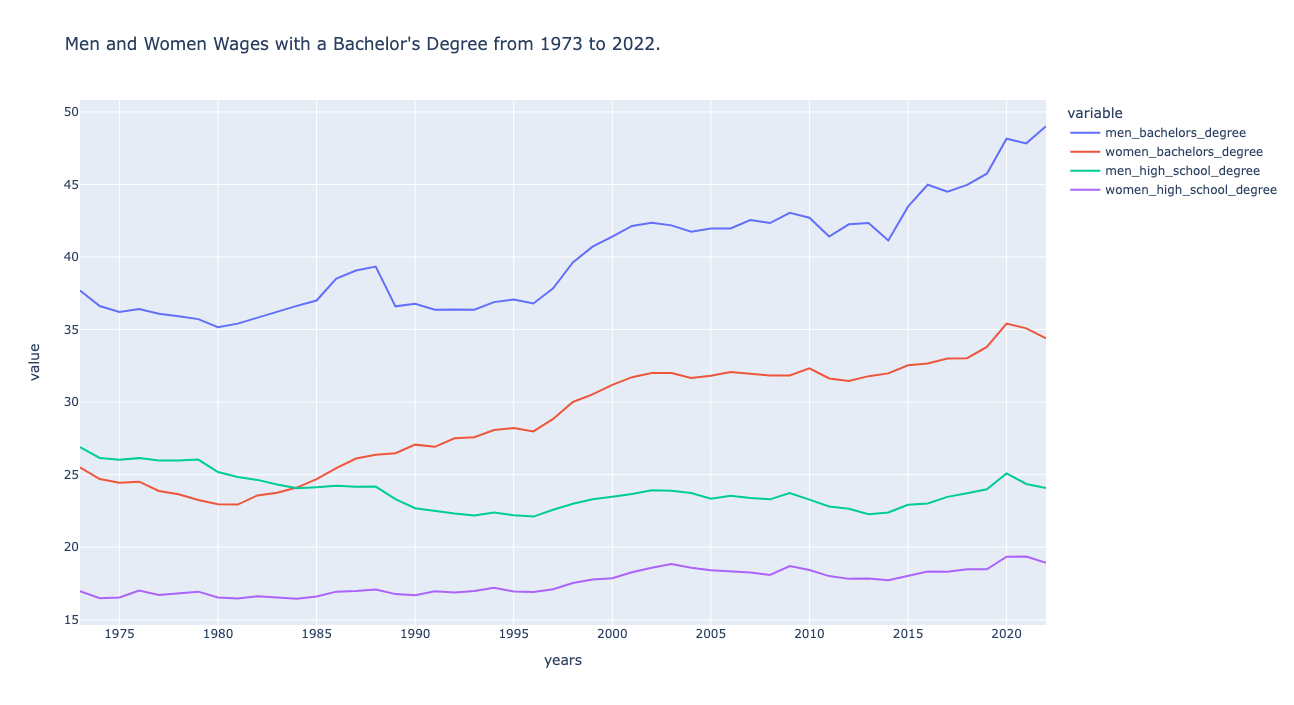
Men vs. Women Wages by Education Level Overtime
Click here to view full interactive visualization!
Insights:
This visualization shows the disparity between men's and women’s wages in America. In
1984, the men with a high school degree and women with a bachelor’s degree finally
intersected; from that point on, women with a bachelor’s degree had a higher wage than
men with a high school degree. However, there is still a large gap between men's and women’s
wages with a bachelor’s degree. In 2022, the average wage for a man with a bachelor’s
degree was $49.01 and the average wage for a woman with a bachelor’s degree was $34.39. The
visualization also shows that this gap was growing farther apart from 2020 and on.
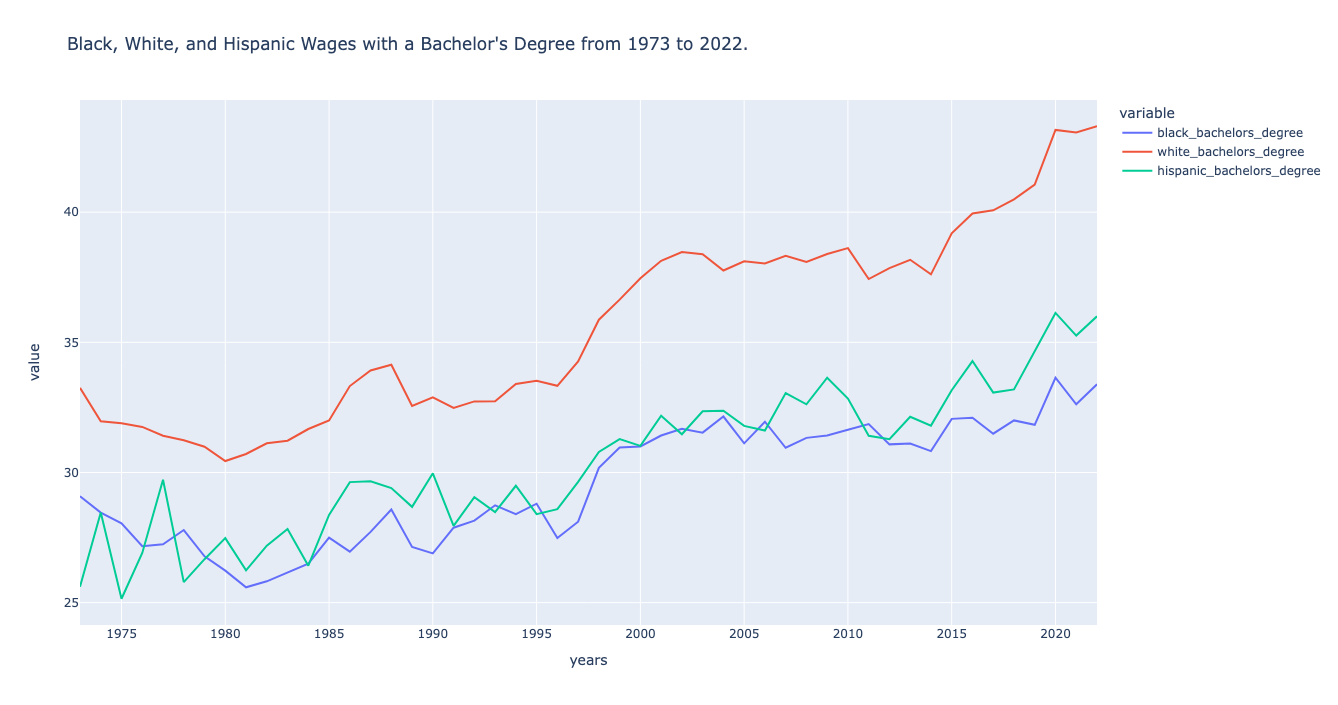
Wages with a Bachelor's Degree Considering Race
Click here to view full interactive visualization!
Insights:
This visualization focuses on Black, White, and Hispanic wages for those with a bachelor’s
degree. We were not surprised by the fact White individuals had a much higher wage than
those of color because of systemic racism in our country. We were surprised by the major
fluctuations in Black and Hispanic wages; we are not exactly sure why there are such major
fluctuations, but the general trend is that they increase over time.